NUREC member states now have access to the Thriving Communities Report tool which contains 35 data indicators related to community Demographics, Belonging, Contribution, Vitality, Thriving, and Green Infrastructure. The data within the Report is sourced from the US Census Bureau, Centers for Disease Control and Prevention, Internal Revenue Service, and other reliable national sources. Create a Report for your community by following the steps below.
Select your Location
Select your Indicators
Generate your Report
Share and Download your Report
Step 1 – Select your Location
Define your Report location. Note, if you access this page via the “Explore the Data” or county hyperlink on your state’s page, Step 1 may already be completed. If that is the case, proceed to Step 2.
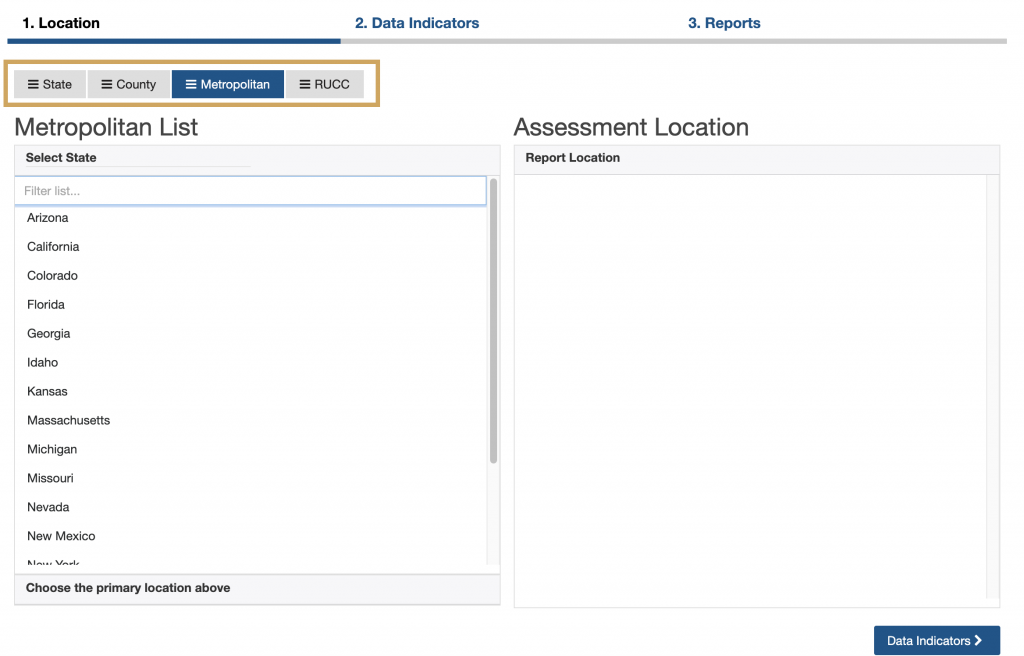
Click the location tab at the top of the Report menu to select a location type (e.g., State, County, MSA, or RUCC; Figure 1).
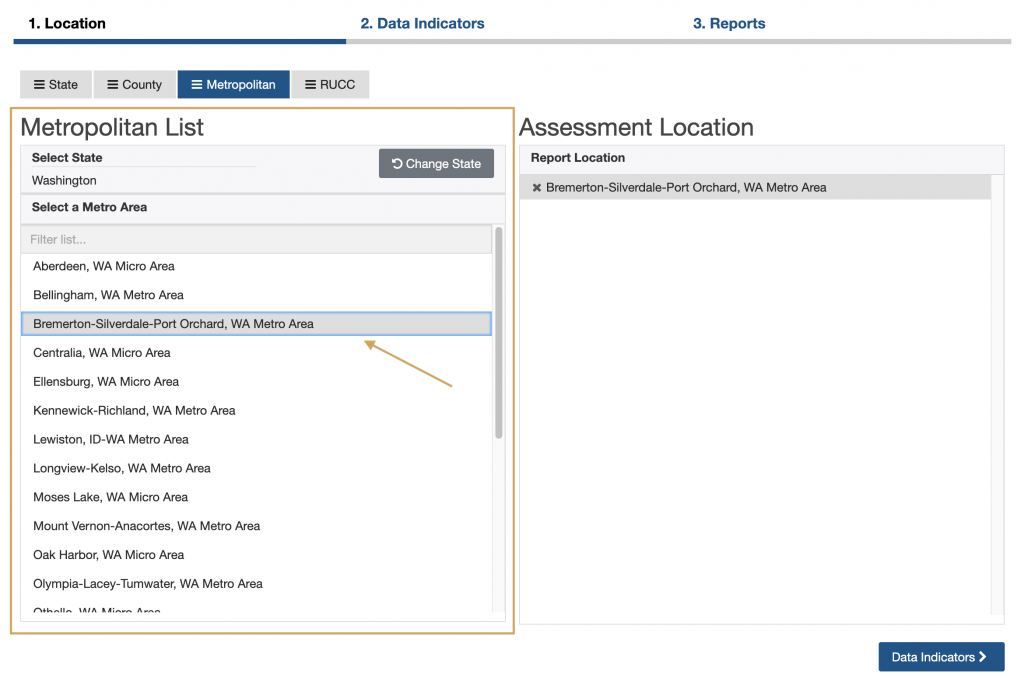
Click the name of your location of interest from the list on the left (e.g., Ellensburg, WA Micro Area; Clark County, WA; or Washington). You may create a Report for any one location at a time (Figure 2).
Your selection will appear, and can be managed, on the right under “Assessment Location.”
After selecting your location, click the “Data Indicators” button at the bottom right to move to Step 2.
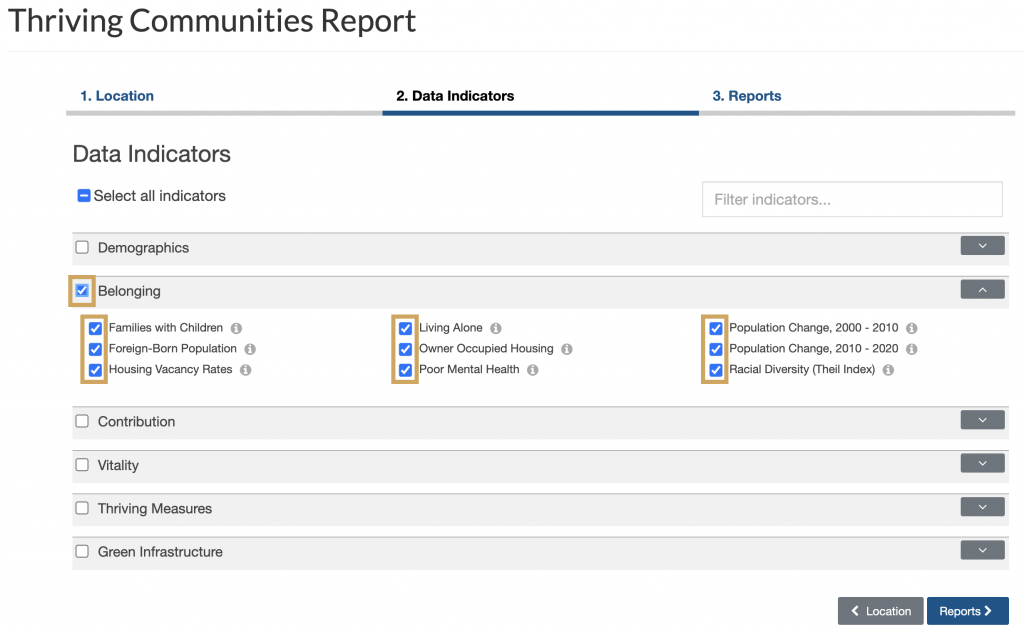
Step 2 – Select your Indicators
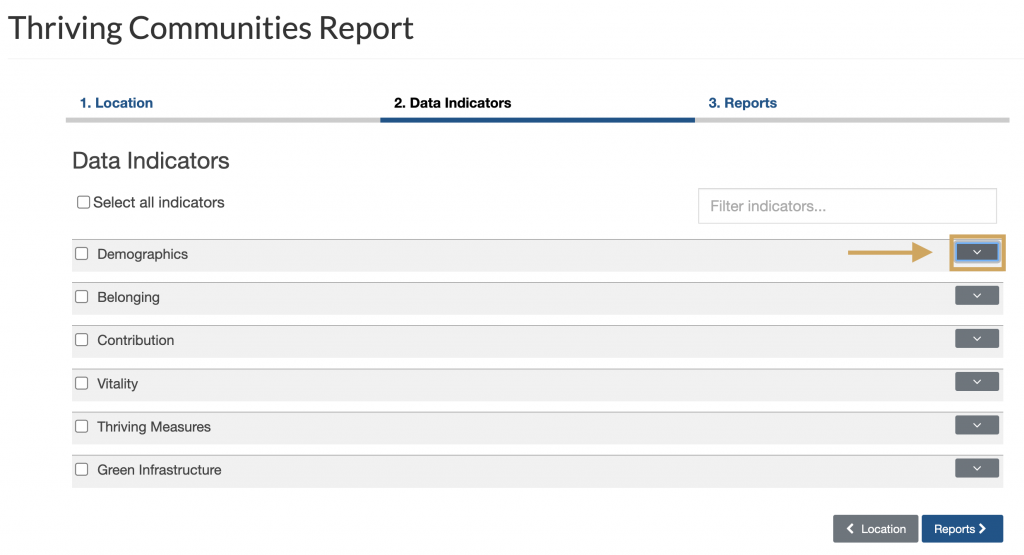
Select the data indicators you want to include in your Report. Click the carets on the right to expand the data categories (Figure 3).
Click the check box next to the indicator name (e.g., Total Population, Access to Childcare Centers, Park Access, etc.,) to add indicators to your Report.
Click the check box next to the data category name (e.g., Demographics, Contribution, Thriving, etc.,) to add an entire data category to your Report (Figure 4).
To see additional information related to the indicator, including source and supplemental data available, click the “i” button on the right of the indicator name.
Click the “Reports” button at the bottom right to generate your Report.
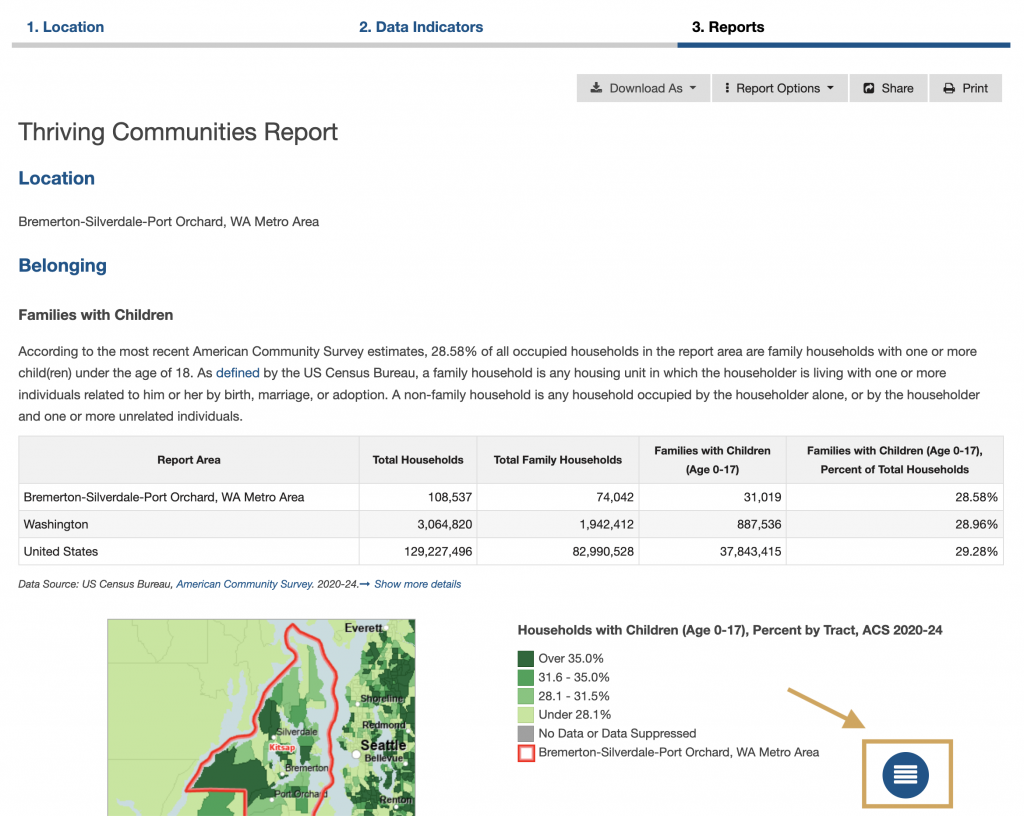
Step 3 – Generate your Report
Explore your completed Report. Scroll down to view the data you selected.
Use the round menu button at the bottom of the page to jump quickly between indicators (Figure 5).
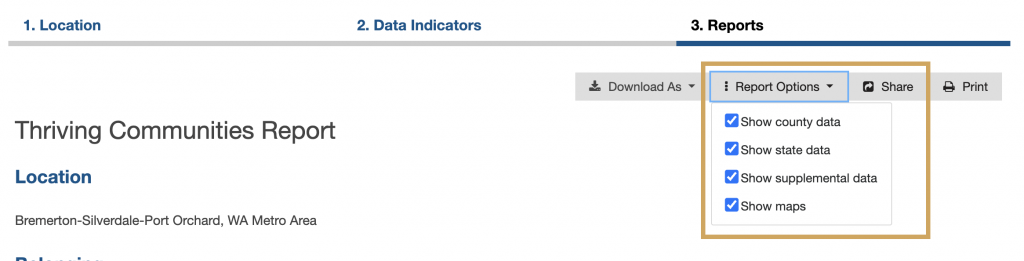
If you want to change the type of data included in the Report (e.g., county-level, state-level, supplemental, maps) click the “Report Options” button in the top right and unselect any checkboxes you do not want displayed (Figure 6).
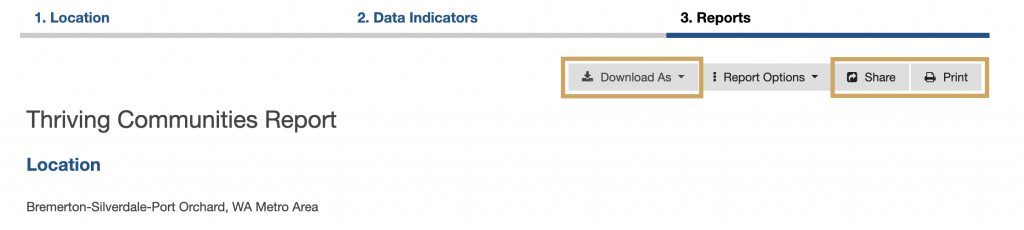
Click the “Share” button at the top of the Report to share it via link, email, or on social media.
Click the “Download As” button to download your Report as a PDF file or the raw data as an Excel table.
Click the “Print” button to print your Report (Figure 7).
Note, if all indicators are selected a large Report will be generated that may take several minutes to fully load. If you would like to reduce the size of your Report, we recommend removing maps, supplemental data (Step 3), or choosing fewer indicators.