We are excited to introduce the refreshed NUREC Member Pages with dynamic data about your Metropolitan and Rural-Urban areas embedded right on the page. Below, find a walk-through of how to navigate the Member Pages and take full advantage of the data at your fingertips. The updated portion of the member pages begins under the “Learn More about your State” heading.
Explore the MSA Map
Explore the RUCC Map
Explore the Data Table
Explore Additional Resources
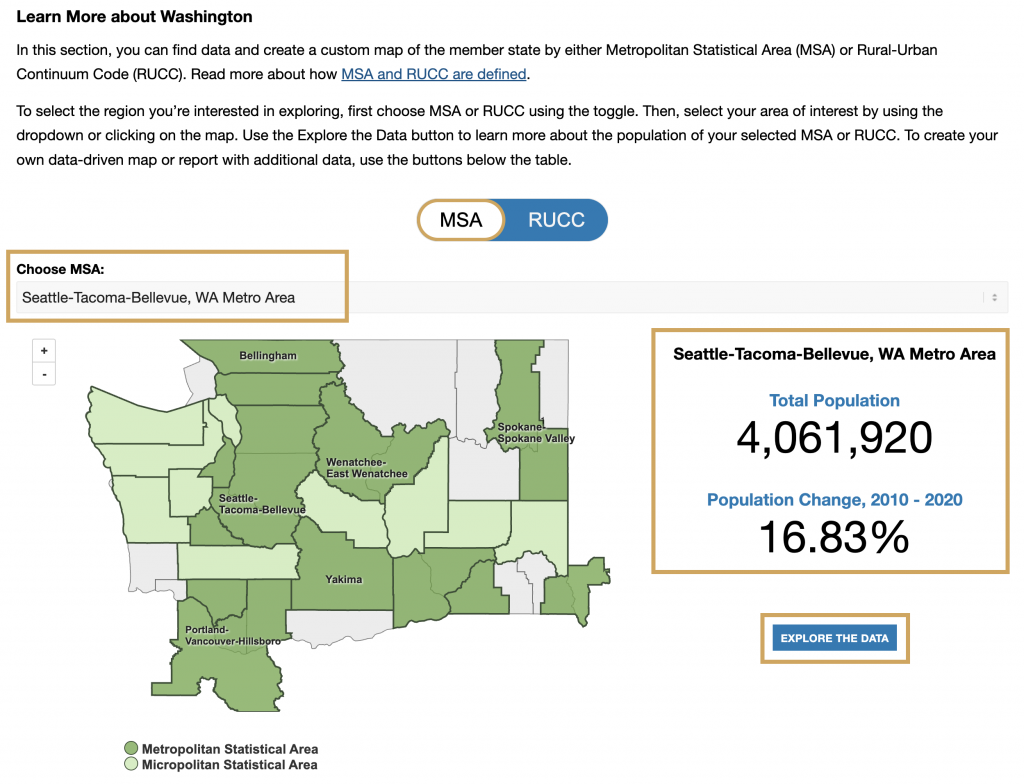
Step 1 – Explore the MSA Map
When you scroll to the new portion of the page, you will see a map that is automatically toggled to MSA. The map shows the Metropolitan and Micropolitan Statistical Areas (MSA) of your state. Click an area on the map or use the dropdown to change the selected MSA (Figure 1).
As you change your MSA, the population data on the right will change. This data shows both the total population and population change of your selected MSA.
To find more information on the MSA, click the “Explore the Data” button. This will take you to the NUREC Thriving Communities Report, with your chosen MSA pre-selected. To learn more about how to navigate the Report, visit our Thriving Communities Report tutorial.
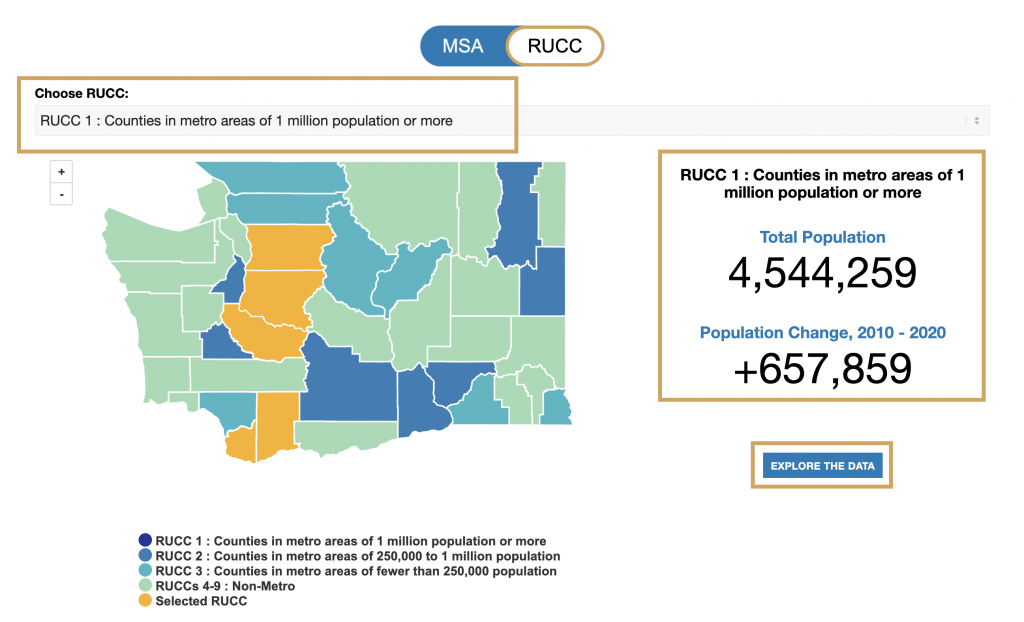
Step 2 – Explore the RUCC Map
To see information based on Rural-Urban Continuum Codes (RUCC) instead, switch the toggle from MSA to RUCC. The map will now show RUUCs for your state, most states include four code groups but some do not include all four.
The possible RUCCs include RUCC 1: Counties in metro areas of 1 million population or more, RUCC 2: Counties in metro areas of 250,000 – 1 million population, RUCC 3: Counties in metro areas of fewer than 250,000 population, and RUCCs 4 – 9: Non-metro. Click an area on the map or use the dropdown to change the selected RUCC (Figure 2).
As you change your RUCC, the population data on the right will change. This data shows both the total population of the RUCC and population change of your selected MSA.
To find more information on the RUCC, click the “Explore the Data” button. This will take you to the NUREC Thriving Communities Report, with your chosen RUCC pre-selected. To learn more about how to navigate the Report, visit our Thriving Communities Report tutorial.
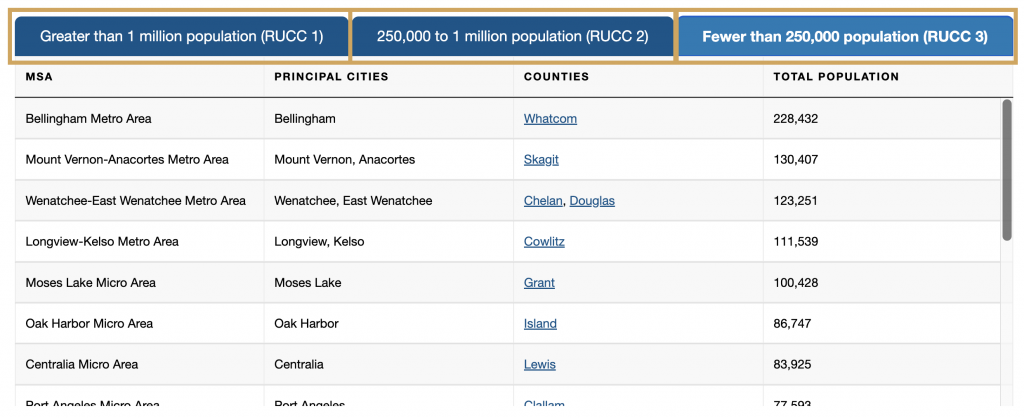
Step 3 – Explore the Data Table
Below the MSA and RUCC maps is a data table. In this table, you will find information on metropolitan communities in your state including MSAs, principal cities, counties, and total population. Of note, if an MSA has more than five principal cities, only the 5 most populous are shown.
Use the tabs at the top of the table to change the data displayed (Figure 3). The tabs at the top of the table are organized by RUCC, grouping the most populous MSAs together. Some tabs include more MSAs than others, so it may be necessary to scroll down the table to see all available information.
To find more information on the counties in the table, click on a county name. This will take you to the NUREC Thriving Communities Report, with your chosen county pre-selected. To learn more about how to navigate the Report, visit our Thriving Communities Report tutorial.
Step 4 – Explore Additional Resources
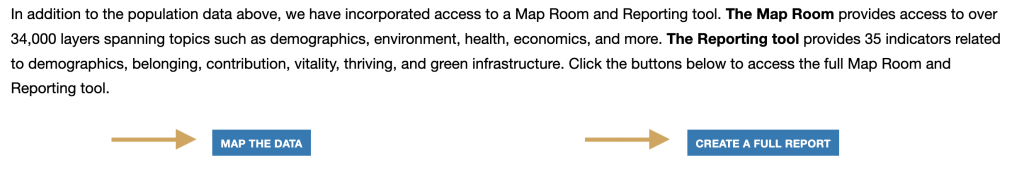
Below the table, you will see two buttons (Figure 4) which allow you to access even more data.
The “Map the Data” button takes you to the full Map Room. To learn more about how to navigate the Map Room, check out the NUREC Map Room Support page.
The “Create a Full Report” button will take you to the Thriving Communities Report. To learn more about how to navigate the Report, check out the Thriving Communities Support page.