The NUREC Map Room hosts over 34,000 mappable data layers. With information spanning topics such as demographics, income, education, health, and housing, the Map Room supports planning, decision-making, and funding requests and can help you explore issues and opportunities in your community.
Search for Layers
Add Layers to your Map
Find a Specific Location
Manage your Layer
Explore Data with Map Room Tools
Export and Share your Map
Step 1 – Search for Layers
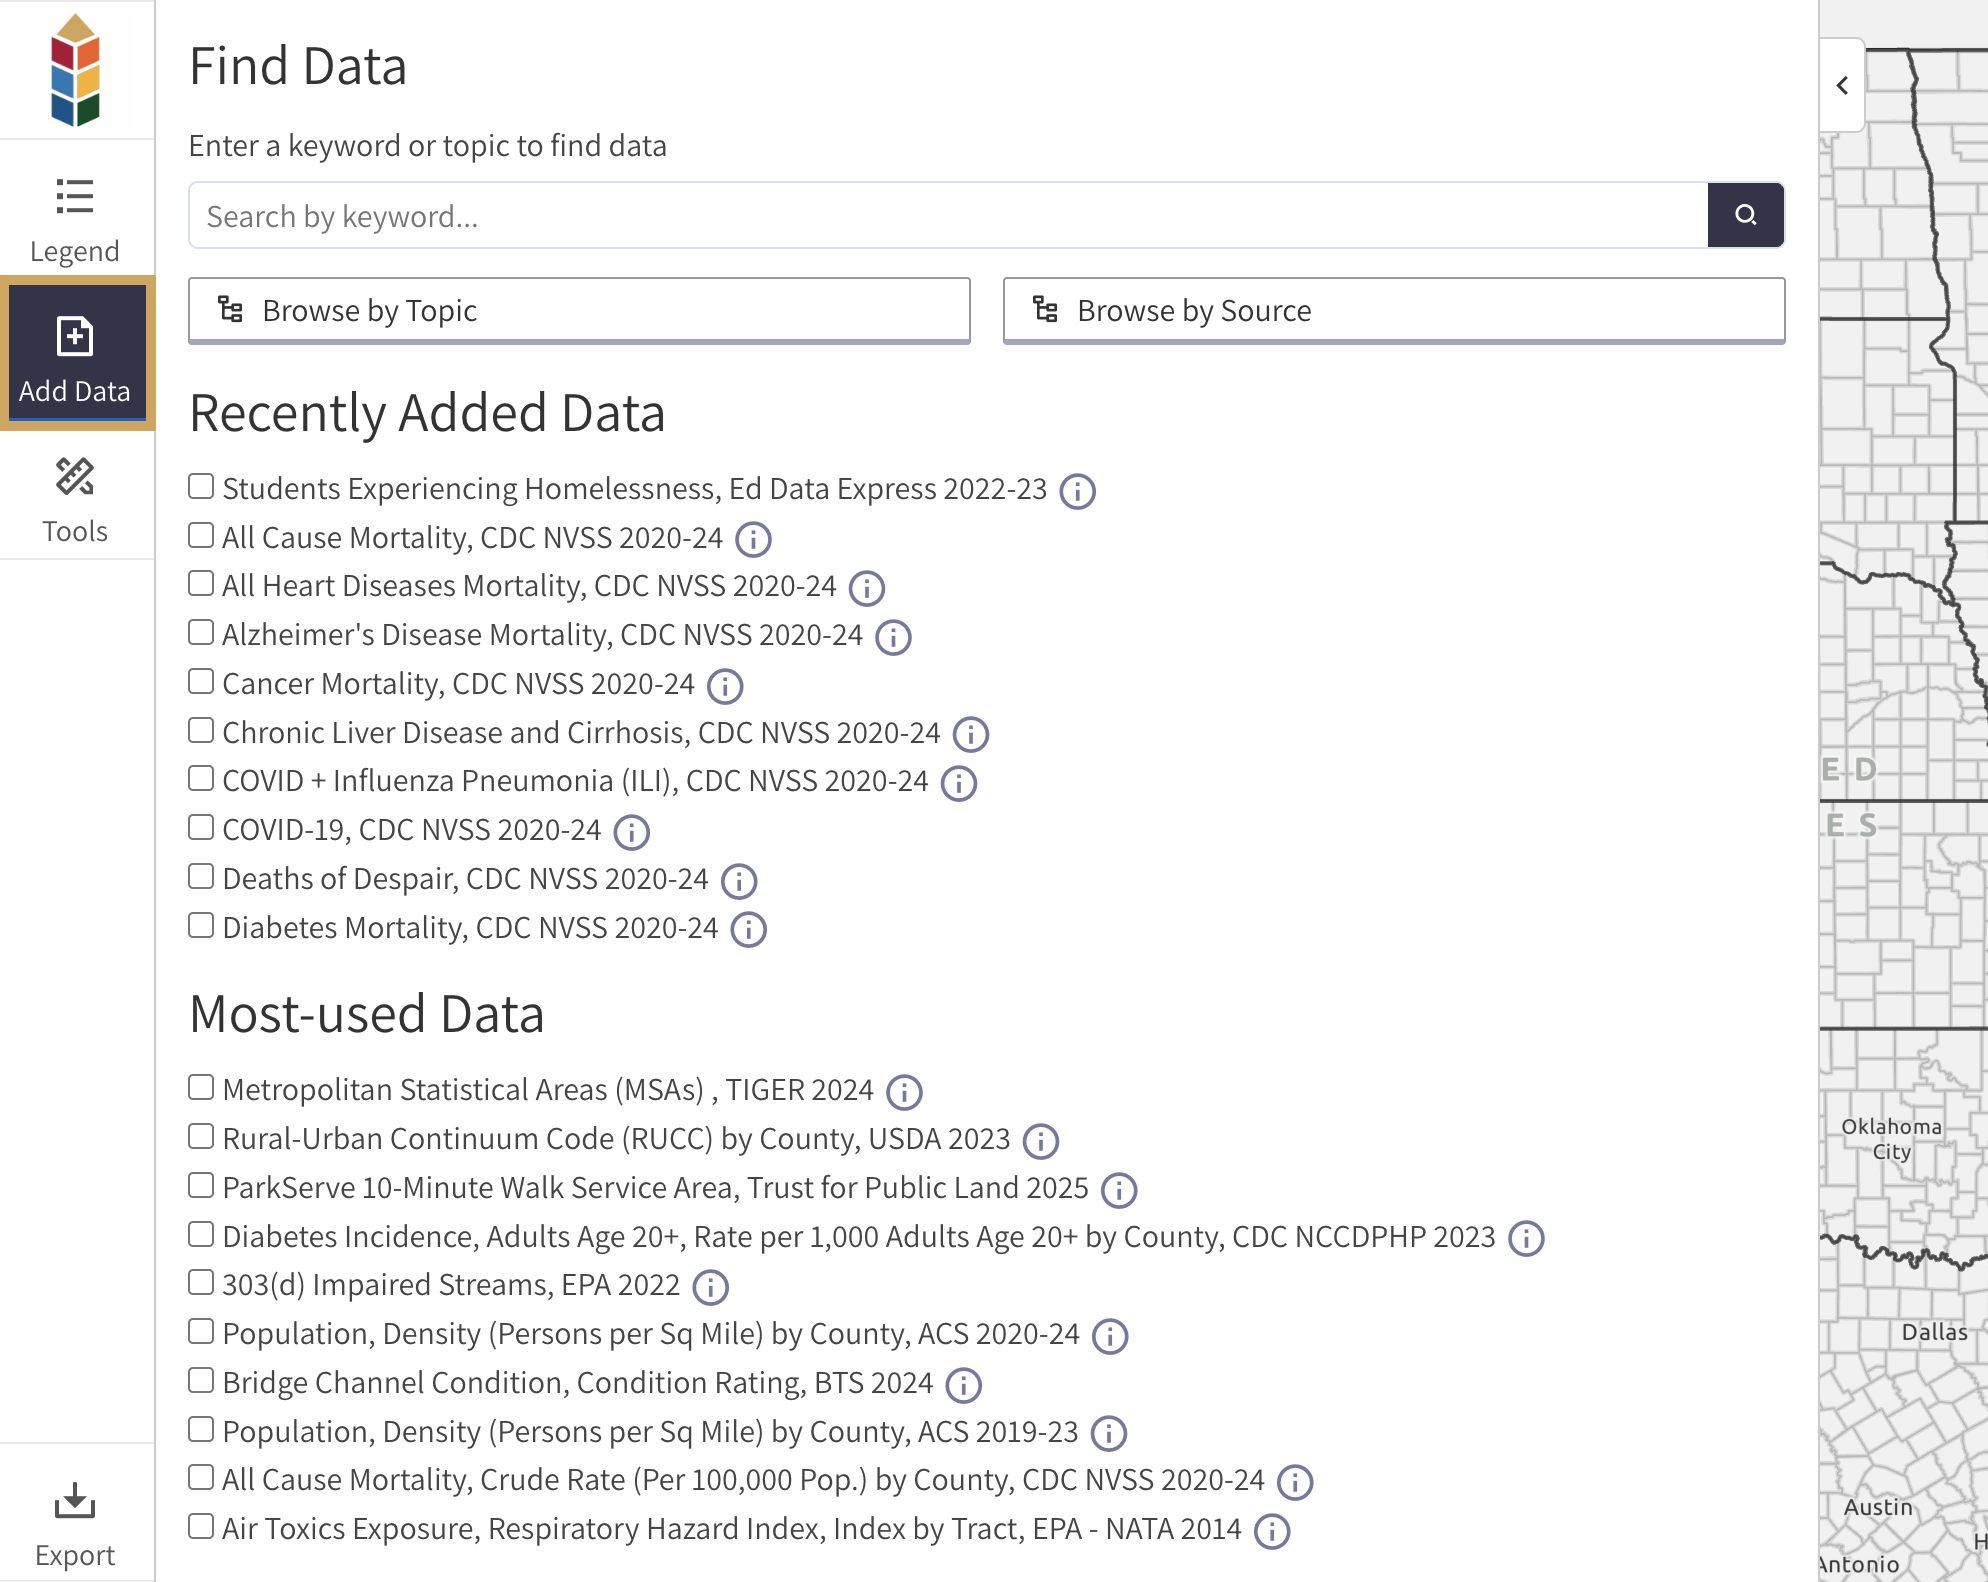
Click the “Add Data” button in the left menu (Figure 1).
Use the search bar to find layers by keyword (e.g., housing, employment, life expectancy, etc.).
Click the “Browse by Topic” or “Browse by Source” buttons to explore data by category and source.
Step 2 – Add Layers to your Map
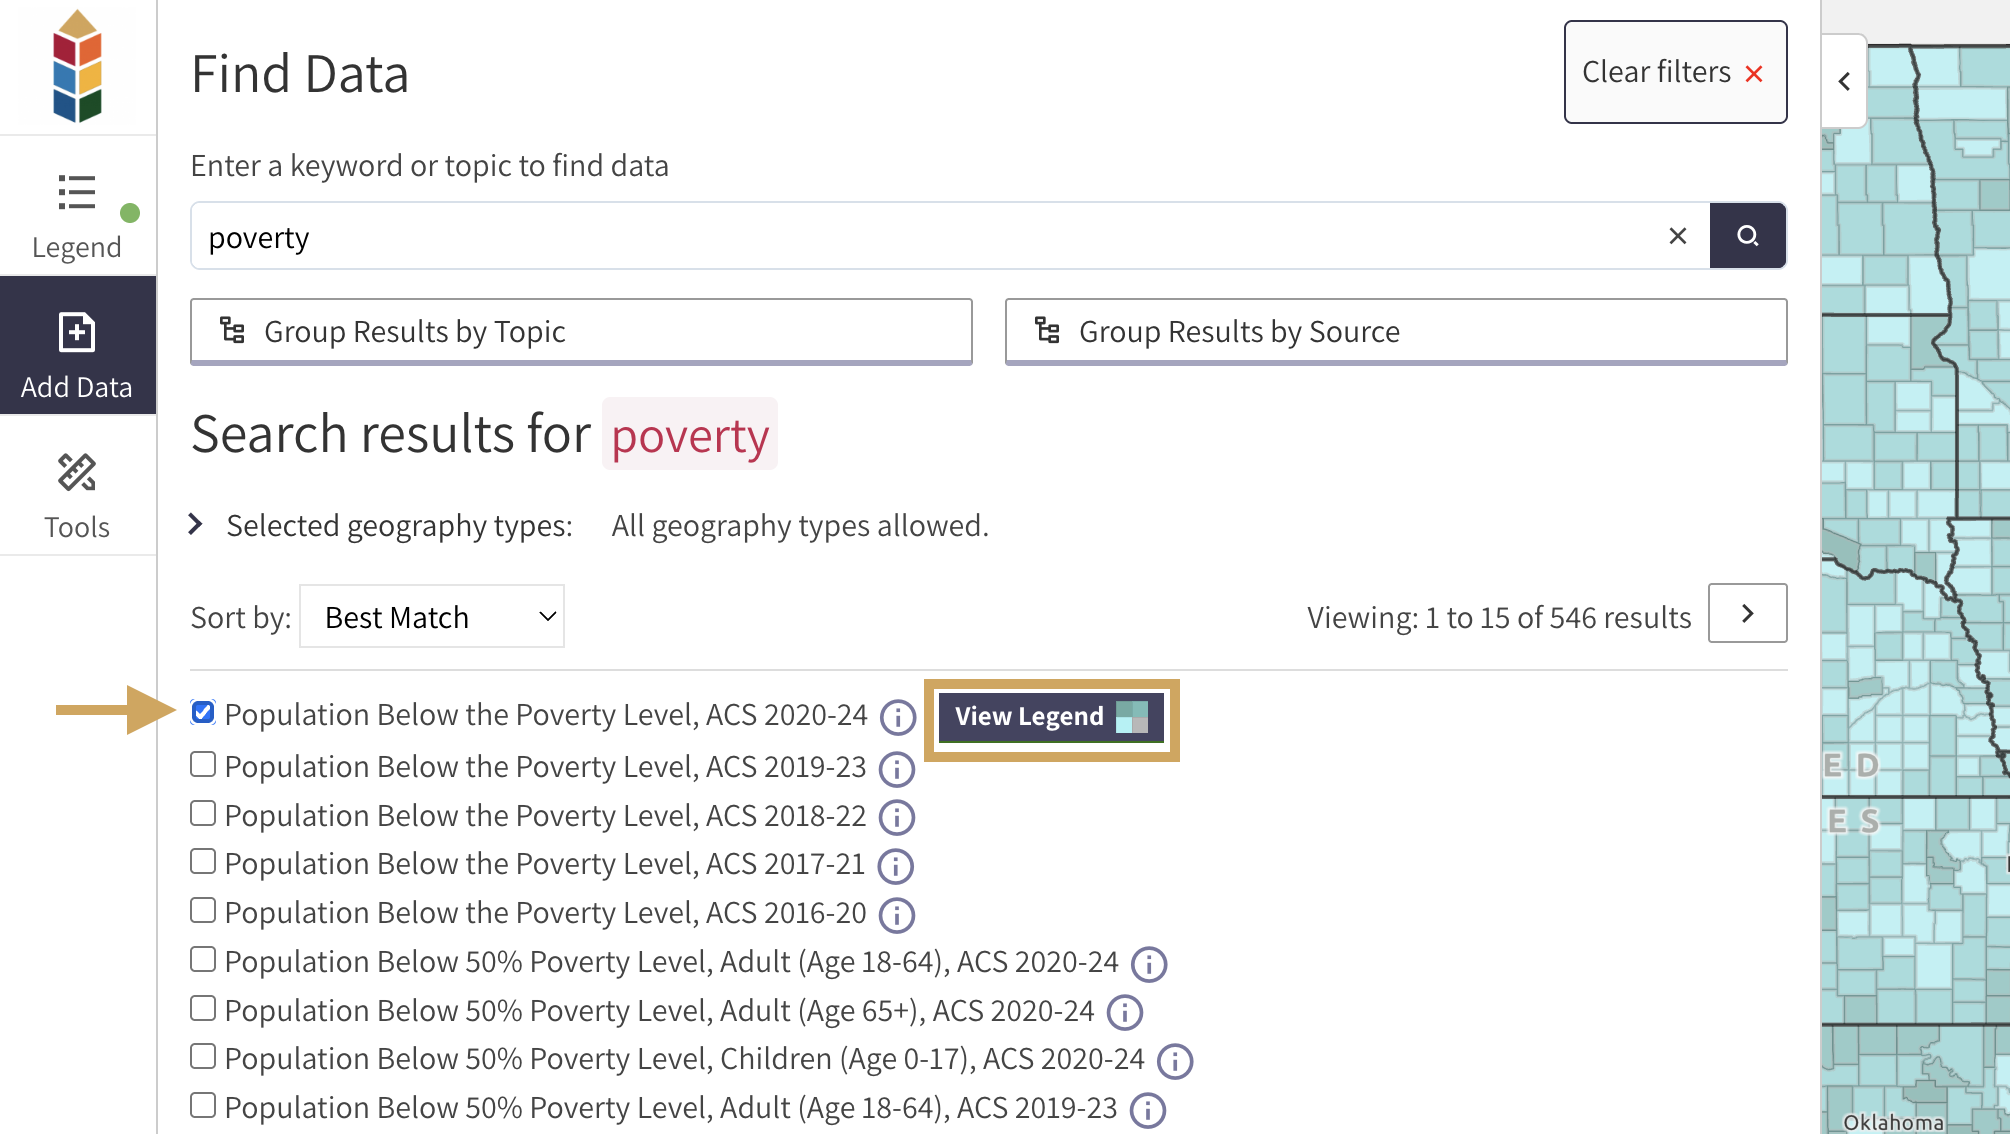
After you have located your data of interest, you can add one or more layers to the map by clicking the checkbox next to the layer name.
Click the “View Legend” button in the left menu to close the search window and open the map legend (Figure 2).
Repeat steps one and two to add additional layers to your map at any time.
Step 3 – Find a Specific Location
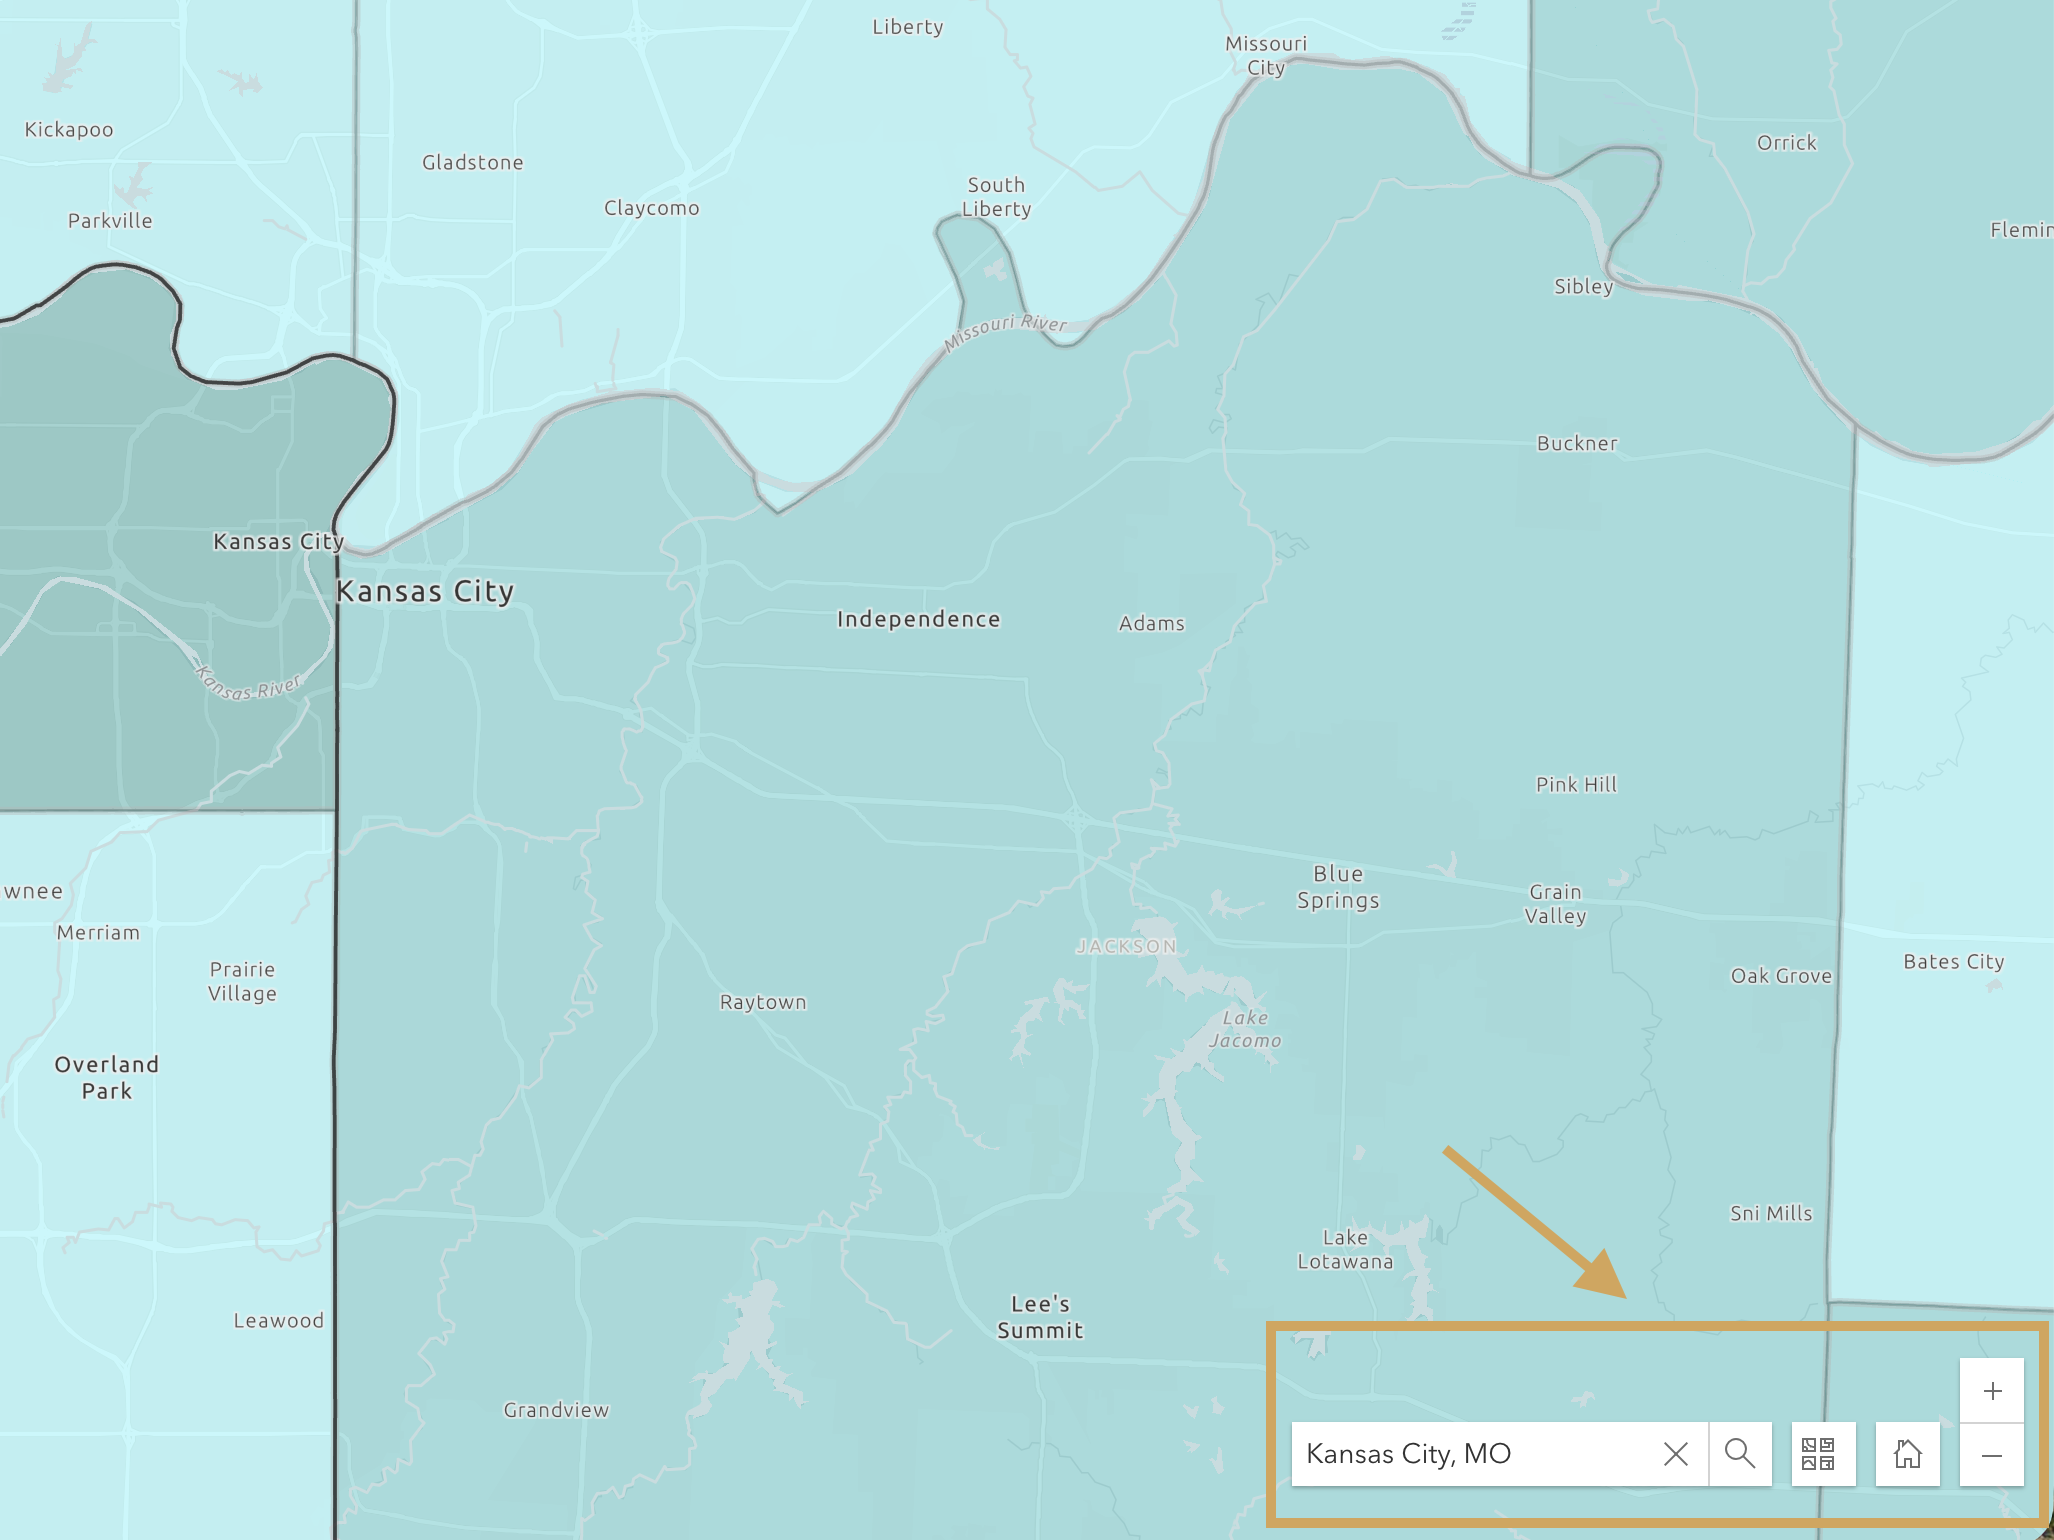
Click the + and – buttons at the bottom right of the map window to zoom in and out.
Click and hold your mouse/cursor to move the map up, down, left, or right.
Type a county name, city, or address into the location search bar at the bottom right to zoom to a specific location (Figure 3).
Step 4 – Manage your Layer
Click the “Legend” button in the left menu to open and close the legend.
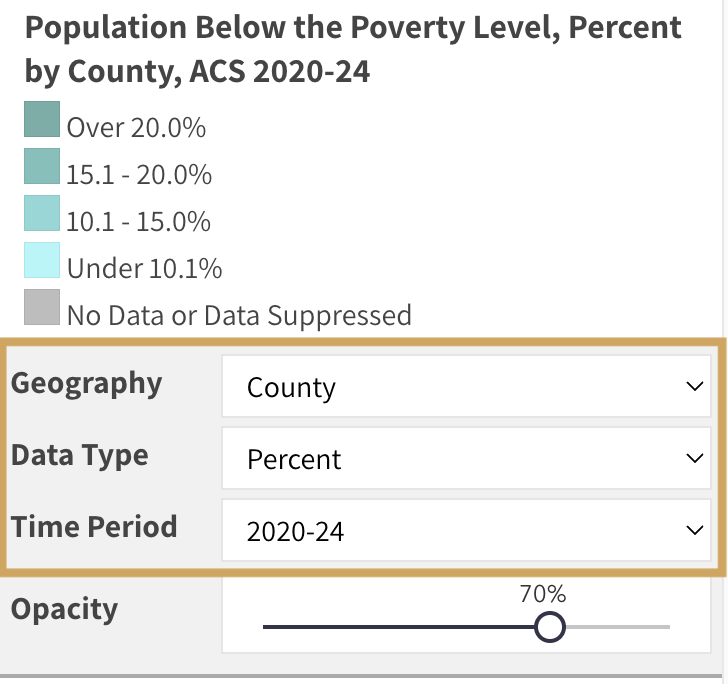
Review the legend. Get familiar with what the colors, points, and lines on the map represent (Figure 4).
Where available, use the drop down menus below the legend to toggle between geographic levels, data types, and time periods.
Step 5 – Explore Data with Map Room Tools
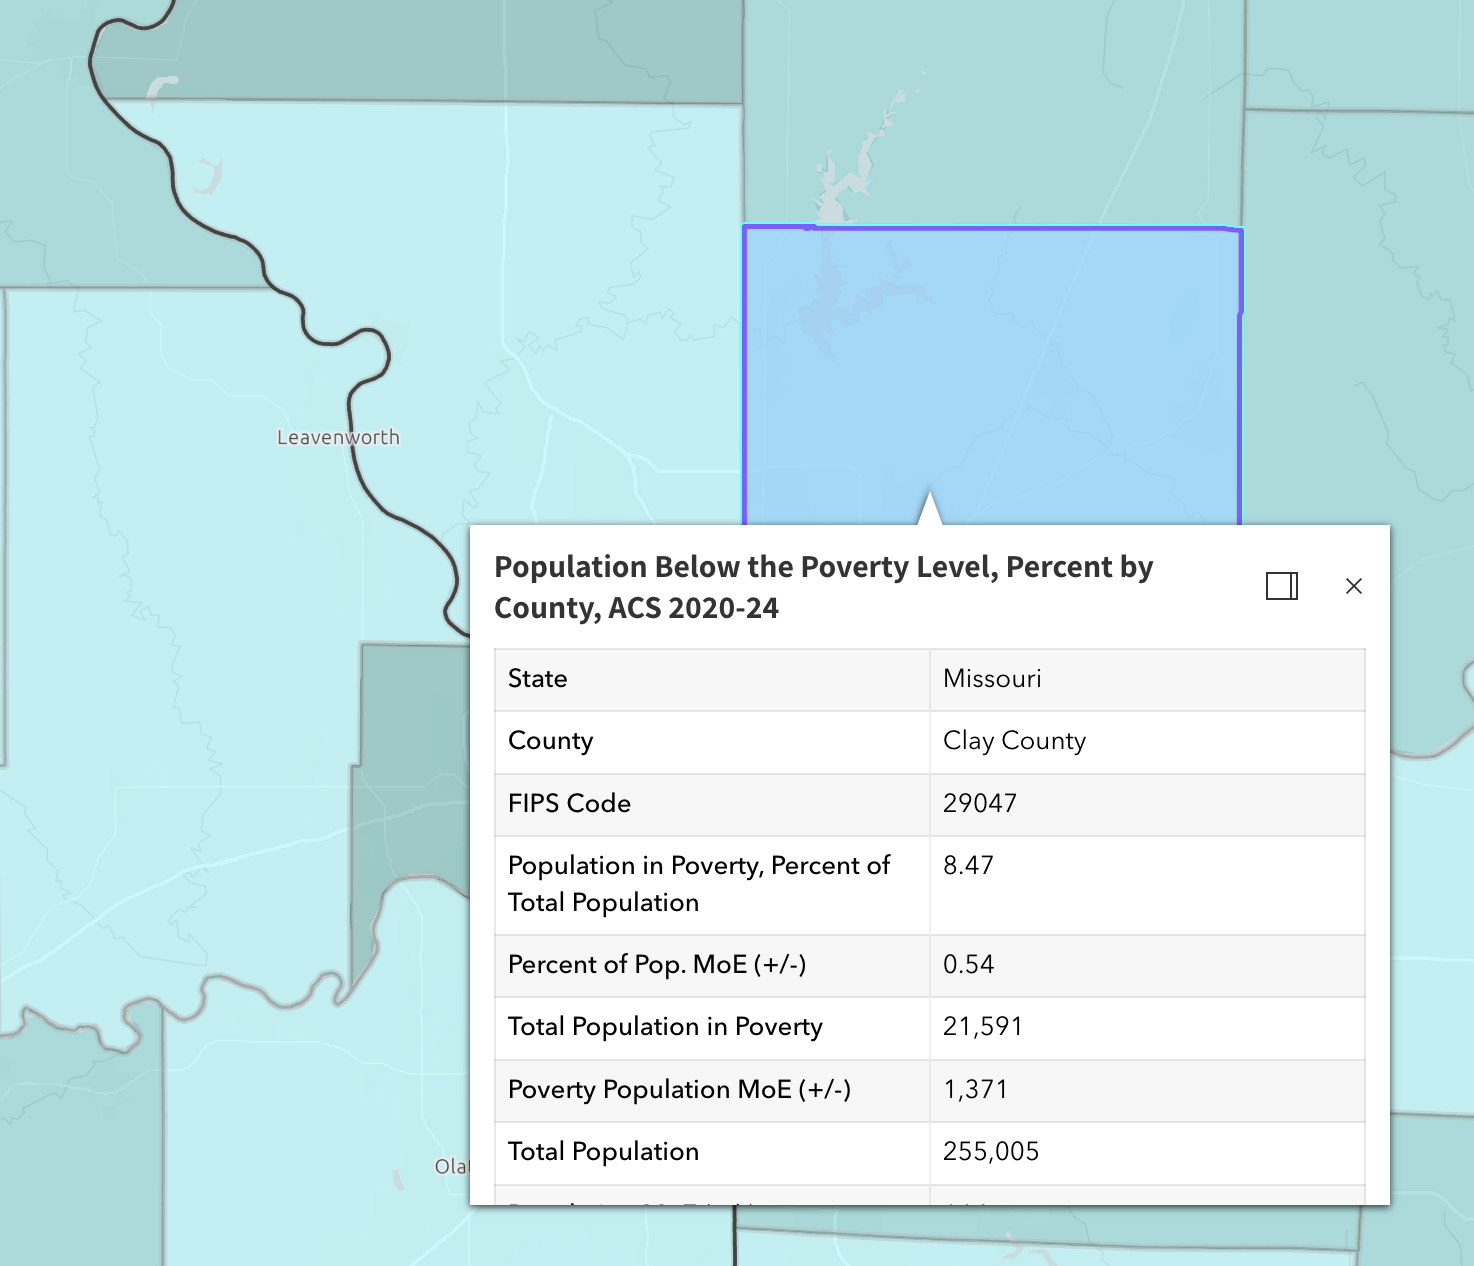
When exploring your map, click on any location to view additional data in a popup window (Figure 5).
The NUREC Map Room has many tools. Below is a brief description of how to access them and what they do.
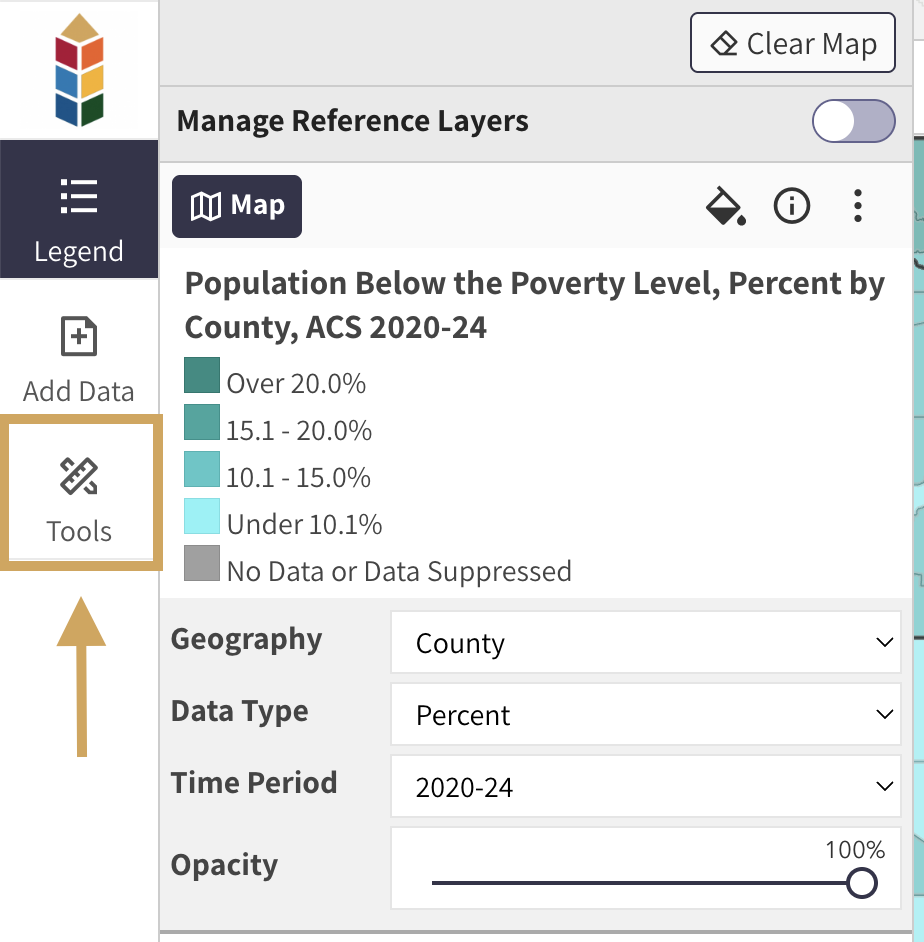
Click the Tools button in the left menu to open the tools interface (Figure 6).
Use the Query Data tool to help answer questions of the data on the map. Set the thresholds to help identify counties in your state that meet or exceed a specific poverty rate, identify the number of medical providers in a ZIP code, and more.
Use the Download Data tool to export data from the map into a .CSV file.
Use the Measure Tools to find geographic coordinates, measure an area, or measure the length of a path.
Use the Draw Graphics tool to add shapes to the map.
Use the Mask tool to hide surrounding areas.
Use the Swipe Layer tool to interact with two layers at once.
Use the Walk Scores tool to choose a point on the map and see how walkable it is.
Use the Customize Map Symbols tool to change the colors of the map, symbols, or label font.
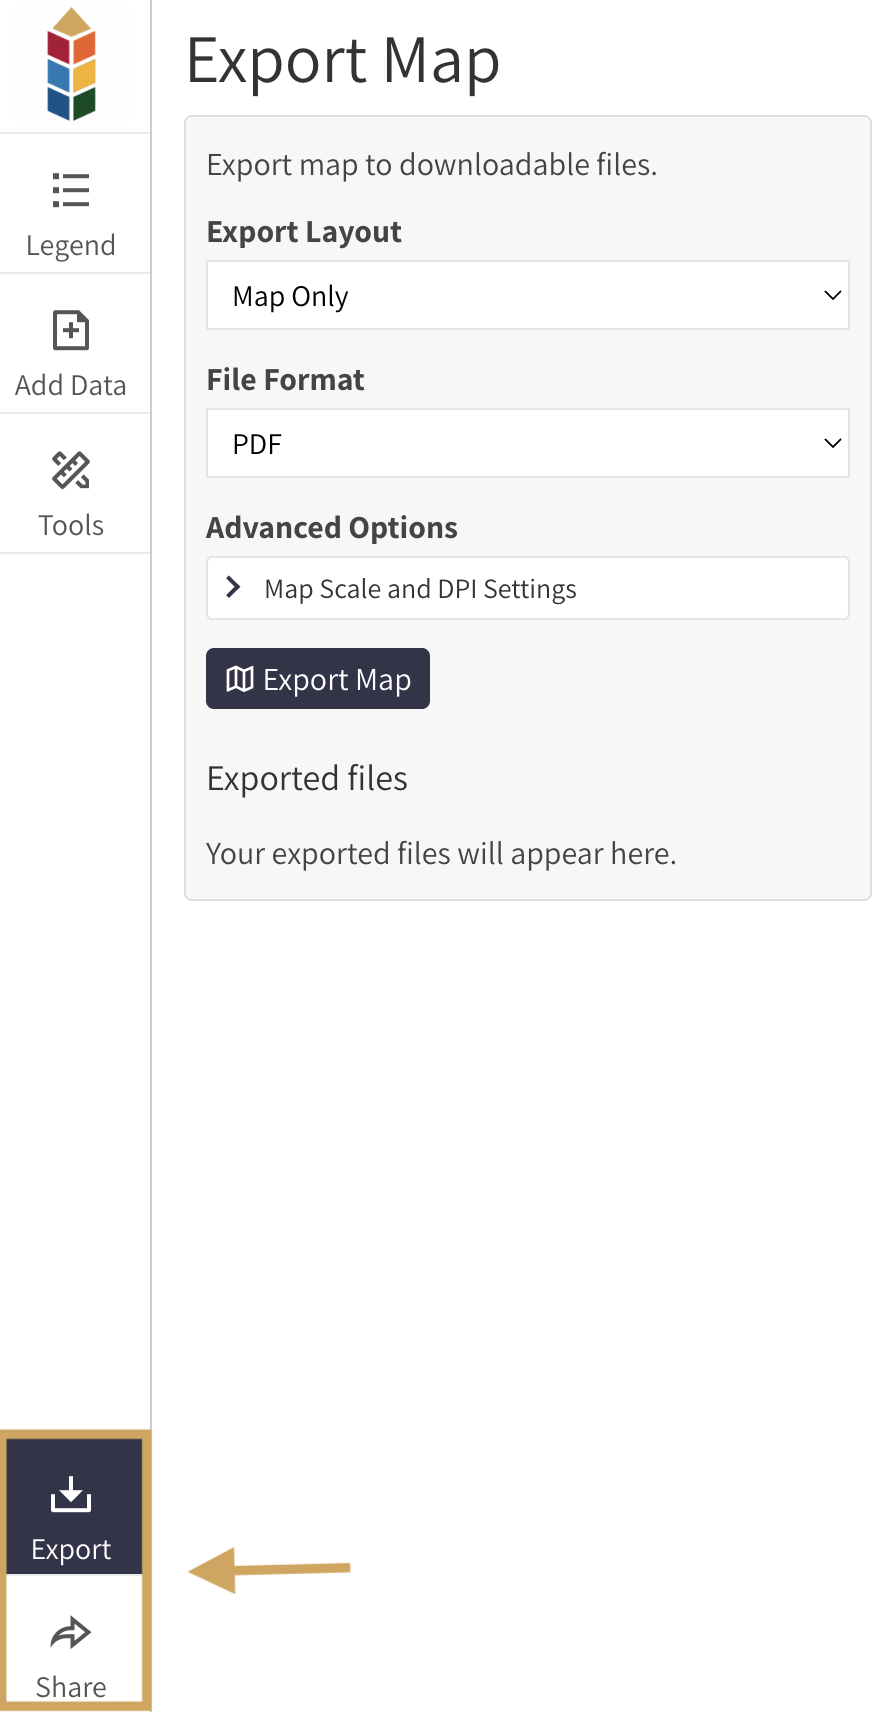
Click the “Export” button in the left menu to download your map as a PDF or image file of your choice.
Click the “Share” button in the left menu to share your map via link, email, or social media (Figure 7).